Before we set foot on JavaScript’s turf, let’s get a feel for our development environment. First we’re going to set up a page where we can do a little work, then we’re going to have a look at that page through the lens of our browsers’ built-in JavaScript debugging tools, and finally, we’ll start making sense of the basic rules of JavaScript syntax.
If you’ve worked with CSS at all, you’ll find that including a script in your page follows more or less the same pattern as including a stylesheet, though with a slightly different syntax and a few small caveats.
Just like CSS, you can embed scripts within the document itself—by wrapping it in <script></script>, the same as you’d use <style></style> tags to include your CSS.
<html>
<head>
    ...
<script>
    // Your scripts go here.
</script>
</head>
All the same drawbacks as in-page styles apply here: if an identical script is meant to be used across multiple pages, there’s no sense in copying and pasting it into every document. You’ll end up with maintenance headaches and pages falling out of sync if you’re updating things as you go along.
Fortunately, just as we use a single stylesheet across multiple pages, we can easily reference an external script anywhere we need it. It looks a bit different from the way CSS uses link, instead adding an src attribute to the script tag.
<html>
<head>
    ...
<script src="js/script.js"></script>
</head>
If you’ve encountered examples of external scripts around the internet, you might have noticed that older examples of script tags tend to have JavaScript-specific attributes bolted onto them by default, such as language or type attributes:
<script language="Javascript" src="js/script.js">
    </script>
<script type="text/javascript" src="js/script.js">
    </script>
These have all been deprecated or made optional in HTML5. We’re better off not bothering with any of them, and sticking with <script src="js/script.js"></script>.
Naturally, script accepts any of HTML’s global attributes—class, id, data- attributes, and so on—and HTML5 has added a few helpful (and optional) attributes to the script element that we’ll get to in a bit.
Where in a document we choose to include our external stylesheets—whether we use <link href="css/all.css" rel="stylesheet"> in the head of the document or just before </body>—doesn’t make a tremendous difference, so we conventionally include them in head. When it comes to JavaScript, though, we need to put a little more thought into placement, no matter whether the scripts are external or part of the page itself.
At the risk of oversimplifying, browsers parse the contents of a file from top to bottom. When we include a script file toward the top of an HTML page, the browser parses, interprets, and executes that script before figuring out what elements are actually on the page. So, if we’re planning on using the DOM to access elements within the page, we need to give the browser time to assemble a map of those elements by looking through the rest of the page—otherwise, when JavaScript goes looking for one in our script, we’re apt to get an error saying that the elements don’t exist.
There are a couple of methods for dealing with this problem within the script itself—the browser has methods for notifying JavaScript when the page has been fully parsed, and we can tell our scripts to wait for that event—but there are other downsides to including script files at the top of a page.
Including too many scripts in the head can make our pages feel slow. Upon encountering a remote script in the head of the document, the browser completely stops parsing the page while it fetches and parses the script, then moves on to either parsing the next script—unless we intervene, scripts are always run in order—or parsing the page itself. By including a great deal of JavaScript in the head of the document, we introduce the potential for users to experience a delay before the page appears.
An alternative to this rendering delay and potential for error is to include scripts at the bottom of the page, just before </body>. Since the page is parsed top-to-bottom, this ensures that all our markup is ready—and the page is rendered—before our scripts are requested.
This means we’re shifting the burden of that slight delay from the rendering of a page to the request for a script, which isn't always ideal; there are times when we might want a script to be parsed as quickly as possible, even before the DOM is available. For example, Modernizr—a collection of scripts that test browser support for CSS and JavaScript features—recommends you include it in the head so the results of those tests are available for immediate use. Modernizr is light enough that the rendering delay it causes is very slight, and the results of its feature tests need to be available to any other scripts on the page, so speed is of the essence—it makes sense to block the page render for a fraction of a second to ensure it works reliably.
While HTML5 removed the need for a lot of crufty old attributes on script, it did add a few new ones to deal with some of the concerns above: <script async> and <script defer>.
The async attribute on a script element tells the browser that it should—predictably—execute the script asynchronously. Upon encountering <script src="script.js" async> at the top of the document, the browser will initiate a request for the file and parse it as soon as it’s available, but go on to parse the rest of the page in the meantime. This handles the issue of “blocking” requests for scripts in the head, but still doesn’t guarantee the page will have been parsed in time for any DOM scripting, so we’ll only want to use this in situations where we’re not going to access the DOM—or where we’re programmatically waiting for the document to finish loading before our script does anything with the DOM. It brings up a new issue, as well: if we’re loading multiple scripts using async, we no longer know if they’ll be loaded in the order in which they appear in the page, so we shouldn’t use async for any scripts that are involved in dependencies.
defer solves the issue of waiting for the DOM to be fully available by indicating to the browser that it should request these scripts but not parse them until it has finished parsing the DOM. defer means our scripts at the top of the document are requested in parallel with the parsing of the page itself—so there's less chance of a perceptible delay for the user, and the scripts don’t fire until the page is ready for modification. And unlike async, defer executes our scripts in the order it encounters them.
These two attributes handily solve all our problems with blocking requests and timing, save for one small catch: while defer has been around for a long time, it was only recently standardized, and async is brand new, so we can’t guarantee they’ll be available in all browsers.
In A Book Apart’s own Responsible Responsive Design, Scott Jehl recommends loading scripts asynchronously using JavaScript itself: a tiny “loader” script in the head of the document that requests additional scripts as needed. This not only allows us to load scripts efficiently and asynchronously, but also to decide whether they should be loaded at all: if we detect that a user is on a device that supports touch events, for example, we can load a script that gives our interface custom touch events. If touch events aren’t supported, we never make that request—and the most efficient possible request is the one we never make.
All of this is a lot to take in, and we’re still only scratching the surface of script loading. In the examples that follow, though, our needs are simple. We want to make sure the page has been completely parsed before any of our scripts run, so nothing needs to be in the head of the document—meaning that there’s no need for defer. An external script outside the head won’t cause any blocking behavior, so we won’t need async either. Since there isn’t a strong case for blocking the page render with the scripts we’ll be writing—and we’re going to need the DOM to be available, later on—we’ll include our external scripts just before the </body> tag.
Before we can write any serious JavaScript, we need to set up a blank canvas—a directory with a plain ol’ HTML document.
<!doctype html>
<html lang="en">
<head>
    <meta charset="utf-8">
</head>
<body>
</body>
</html>
For the sake of keeping things simple and consistent, we’re going to load our external script just before we close the body tag. Since it’s external, our script element will have an src attribute pointing to our script file—which, for now, is just an empty file named script.js. I usually save mine in a js/ subdirectory—it’s not a requirement by any stretch, but it can help keep things organized.
<!doctype html>
<html lang="en">
<head>
    <meta charset="utf-8">
</head>
<body>
    <script src="js/script.js"></script>
</body>
</html>
As with HTML and CSS, there isn’t a lot of overhead to get started with JavaScript—any plaintext editor will do. JavaScript syntax can be a little harder to parse with the naked eye, though—at least until you’ve been steeped in it for a while. Having your editor assign colors to keywords, functions, variables, and so on will make a script file a lot easier to understand at a glance.
Fortunately, you’d be hard-pressed to find a modern code editor that doesn’t handle JavaScript syntax highlighting right out of the box. It’s a safe bet that your editor of choice handles JavaScript syntax highlighting just as handily as it does markup and CSS, just by merit of our file having the .js extension—not that we’d know that from opening up our still-empty script.js file.
We’ll need that for sure once we start assembling JavaScript’s component parts into purposeful, functional script files. While we’re getting the hang of the basics, though, let’s open our preferred browser and start getting a feel for in-browser development tools.
There was a time—not all that long ago, honestly—where browsers didn’t give us much help dealing with JavaScript. At best we’d get a heads-up that there was an error of some kind, and a sometimes-accurate guess at the line number where it occurred. Debugging a script meant making a change, reloading the page, hoping nothing blew up, and repeating the process if it did. There was usually no way of getting more details on the issue—at least, no particularly helpful details.
Luckily, our development tools grew up as JavaScript got more and more advanced, and modern desktop browsers all come with advanced JavaScript debugging tools built in. We can still approach development that way, of course, but it’s a bit like using the back of a nail gun to pound nails into a board, and just as likely to end with us getting shot in the foot.
In the grand scheme, getting a feel for your dev tools will end up saving you a tremendous amount of time tracking down bugs. For our purposes, it gives us a space to start experimenting with JavaScript’s syntax.
We’ll be looking at Chrome’s dev tools here, but the basics will apply to whatever browser you most prefer. Browsers’ dev tools are usually similar right down to the command you use to open them up: command+option+i on a Mac and control+shift+i on a PC. Things will look a little different from browser to browser, but you’ll find that all of them share a very similar layout.
Now, if you’ve already spent some quality time with these tools in your development browser of choice, inspecting elements and debugging CSS issues, then you’ll be familiar with the “elements” tab, showing all the elements on the page and their associated styles. Beyond that, the other tabs will vary a bit from browser to browser.
Most developer tools also feature a “network” tab, allowing you to monitor the number and size of the requests made by a page and the time it takes to load them all, as well as a “resources” tab, to let you look through all the resources associated with a page, from stylesheets to JavaScript files to cookies. Some browsers will also include network information under “resources.” There’s usually some form of “timeline” tab that charts information about how a page is rendered, such as the number of times the browser has to go through and “repaint” the styles throughout the page—you may have to reload the page with this tab open before you see much (Fig 1.1).
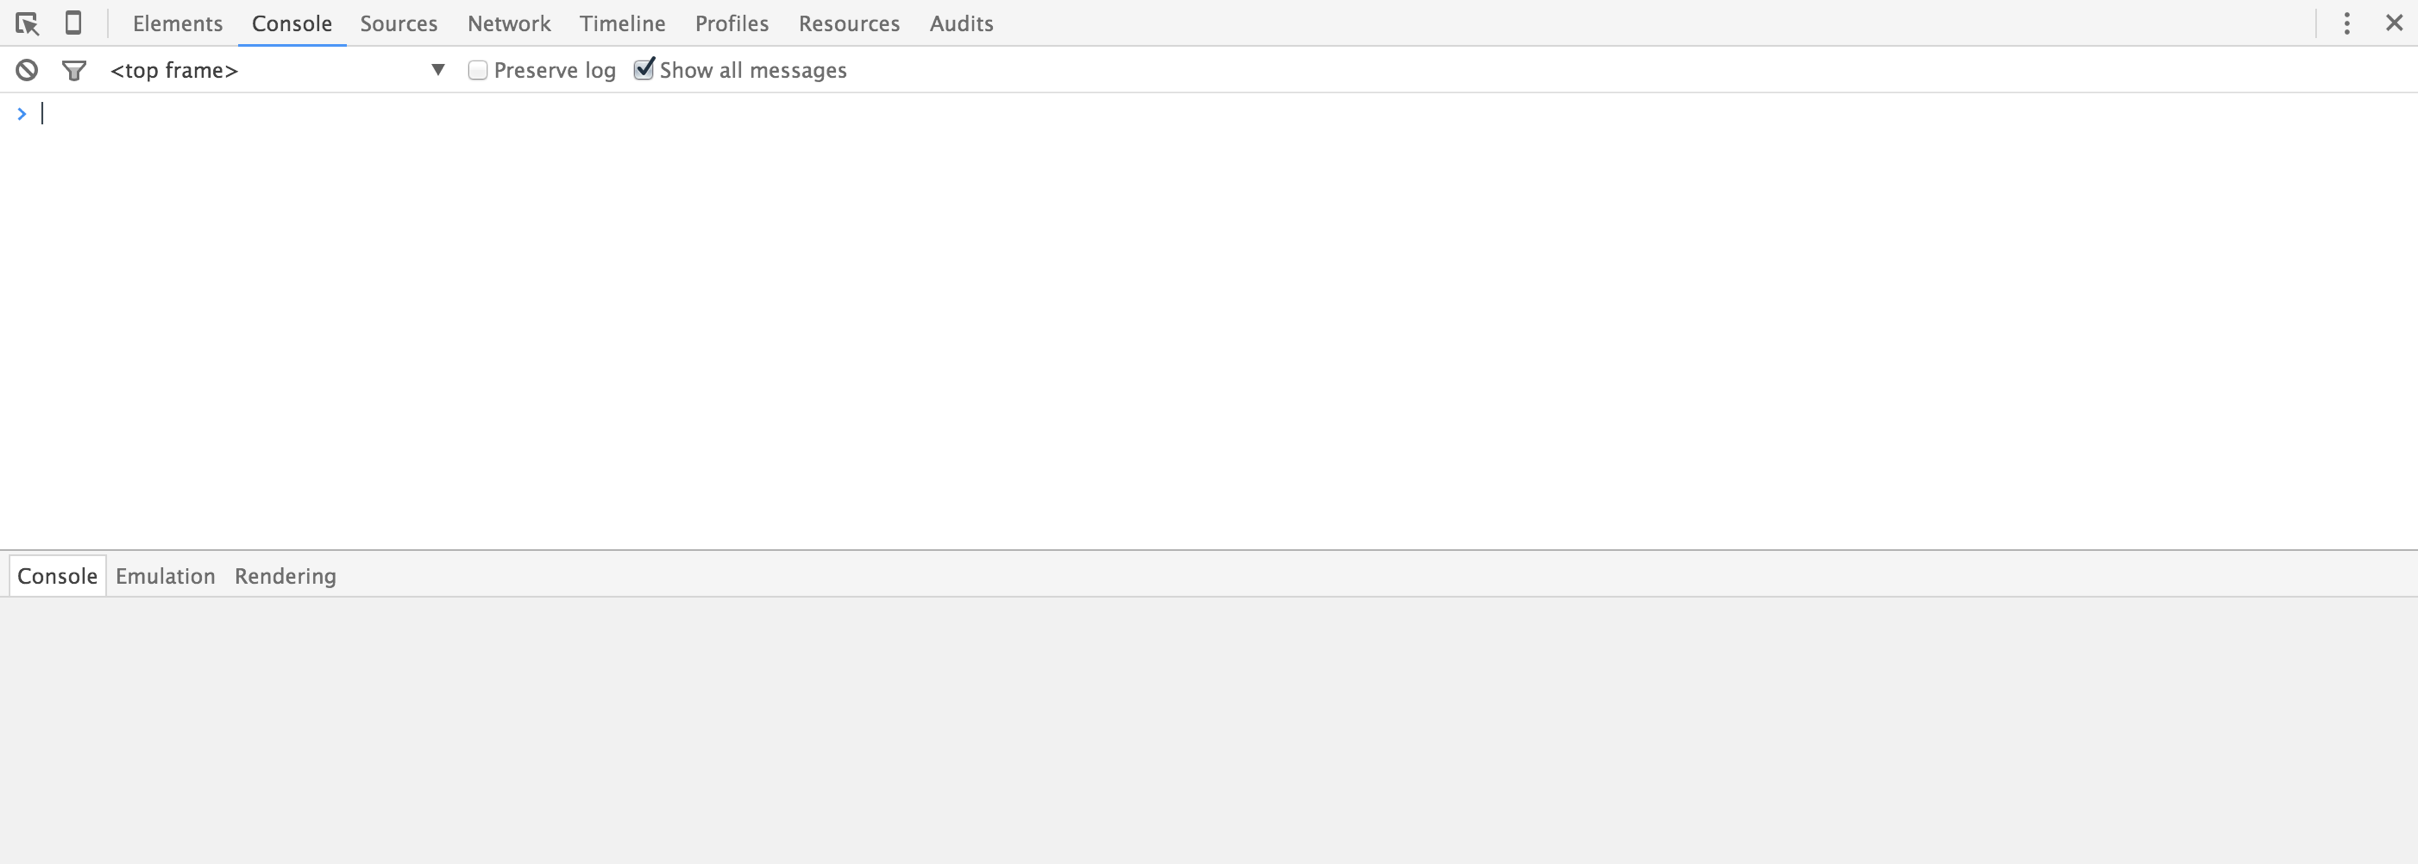
Fig 1.1: Chrome’s dev tools open to the “console” tab.
We’ll be spending most of our debugging time in the “console” tab, which allows you to run JavaScript in what’s known as a REPL, or read-eval-print loop. You can write JavaScript into the console and execute it the same way the browser’s JavaScript engine would if it lived in the page. This has a couple of benefits: first, we can start tinkering with JavaScript on any page we want, without worrying too much about a dev environment. Second, anything we write in the console is designed to be ephemeral: by default, any changes you’ve made in JavaScript will be wiped out if you reload the page.
The JavaScript console has two main functions when it comes to testing and debugging: it provides us with a place to log errors and information, and a JavaScript prompt for interacting with the page and our scripts directly.
In its simplest form, the JavaScript console serves to show you any syntax errors in your scripts—if a typo should sneak into your script or part of the script references something that doesn’t exist, you’re no longer left wondering what’s keeping your script from running.
Most dev consoles go further than only showing outright errors, providing you with warnings about features that browsers might be removing soon, failed requests, and so on. It’s very rare that I do any development without the console open, just to be on the safe side.
Oftentimes, though, we’ll encounter a situation where there aren’t any outright errors in our scripts, but things still don’t seem to be working quite the way we’d expect them to—or we need a simple way to flag for ourselves that certain parts of a script are being executed, since so much of our logic is happening invisibly. In these cases, you can use some methods built into the browser to send up the occasional signal flare—to send yourself messages, inspect the contents of variables, and leave a trail of breadcrumbs showing a path through the logic of a script.
In the olden days, we repurposed a few of JavaScript’s earliest built-in methods to perform some basic debugging—the much-derided alert(), a method that causes a native modal window to appear bearing our message of choice, in quotes between the parentheses, and an OK button to dismiss it (Fig 1.2).
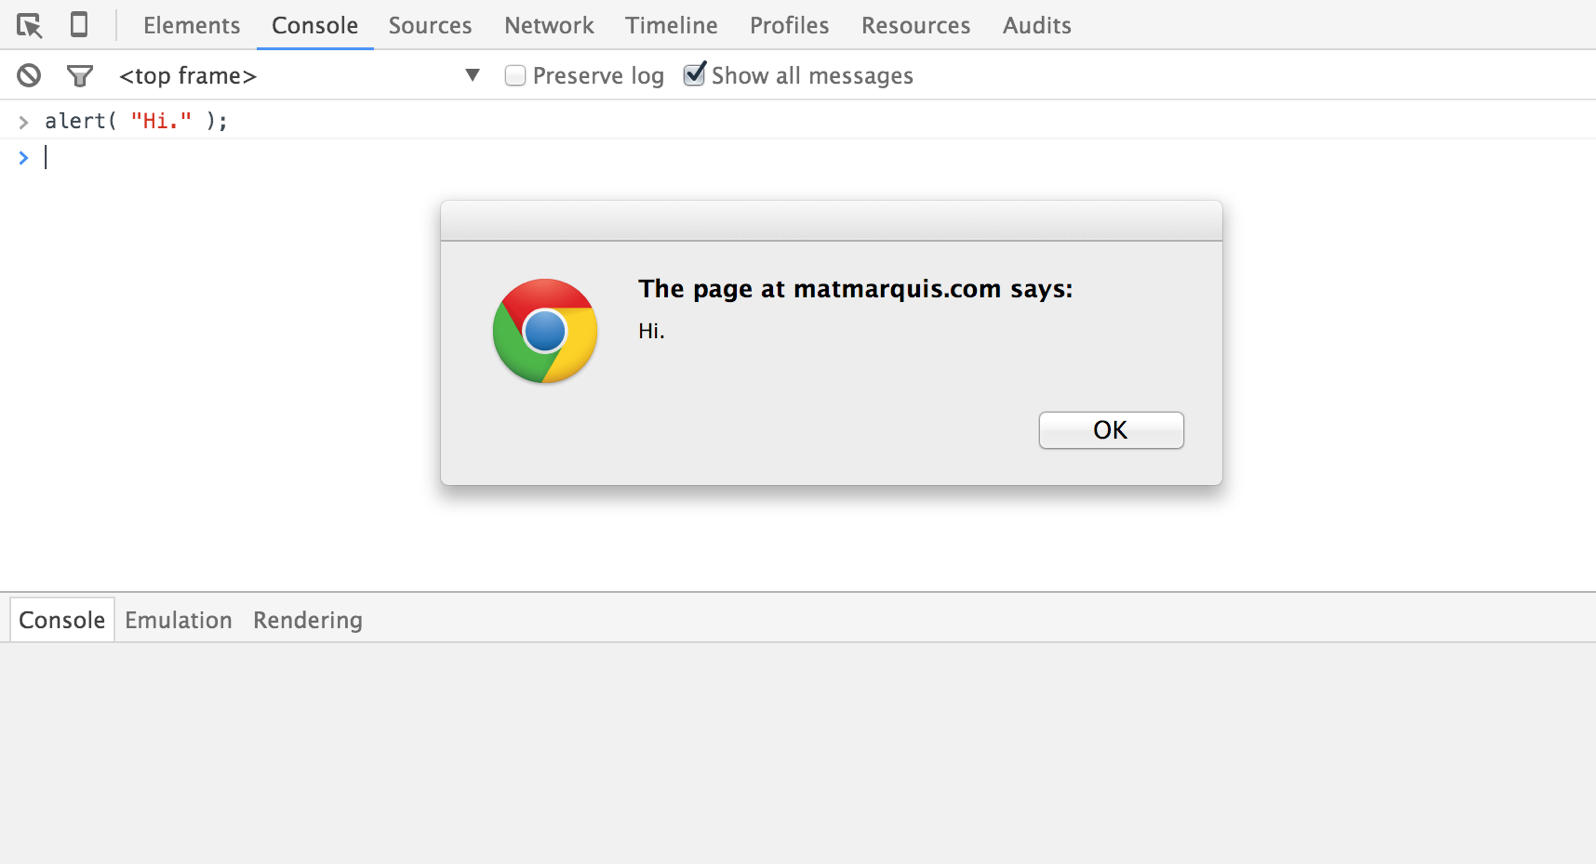
Fig 1.2: Using alert() on a live website is the JavaScript equivalent of shouting “fire” in a crowded theatre: it isn’t illegal, but certainly isn’t going to win you any friends.
There were a few equally exciting variations on this method: confirm() allows the user to “OK” or “cancel” the text we specify, and prompt(), which allows the user to input text in the modal window—both of these reported the user’s selection and input back to us for further use in our scripts. If you’ve agreed to an “end-use license agreement” or spent any quality time with Geocities in the past, you’ve likely encountered all of these at some point or another.
JavaScript developers learned pretty quickly that this was an obnoxious way to interact with users, and none of these methods see much use these days—at least, not much unironic use.
What we did learn is that it gave us a quick and easy way of communicating things to ourselves while debugging, allowing us a little insight as to what was going on in our scripts. Inefficient as it was, we could set alerts telling us how far a script had progressed, whether parts of a script were being executed in the right order, and (by seeing which was the last alert to fire before we ran into an error) track down glaring issues line-by-line. This sort of debugging wouldn’t tell us much, of course—alert was really only designed to pass along a string of text, which would often mean inscrutable feedback like [object Object] when we wanted to look closer at what a part of our script meant.
These days, browsers compete on the quality of their dev tools, and we have tons of options for digging into the internals of our scripts—the simplest of which is still to send ourselves a message from inside the script, but with the potential to contain much more information than a simple string of text.
The simplest way to output something to the console from our script is a method named console.log(). In its simplest form, console.log() works just like alert()—allowing you to pass yourself a note within your script.
We’ve officially reached the point where some things are easier to show than to tell, so let’s open up script.js in our editor and try the following line out for ourselves:
console.log("Hello, World.");
Save the file, switch back over to your browser, reload the page—and we’ve just written our very first line of JavaScript together (Fig 1.3).
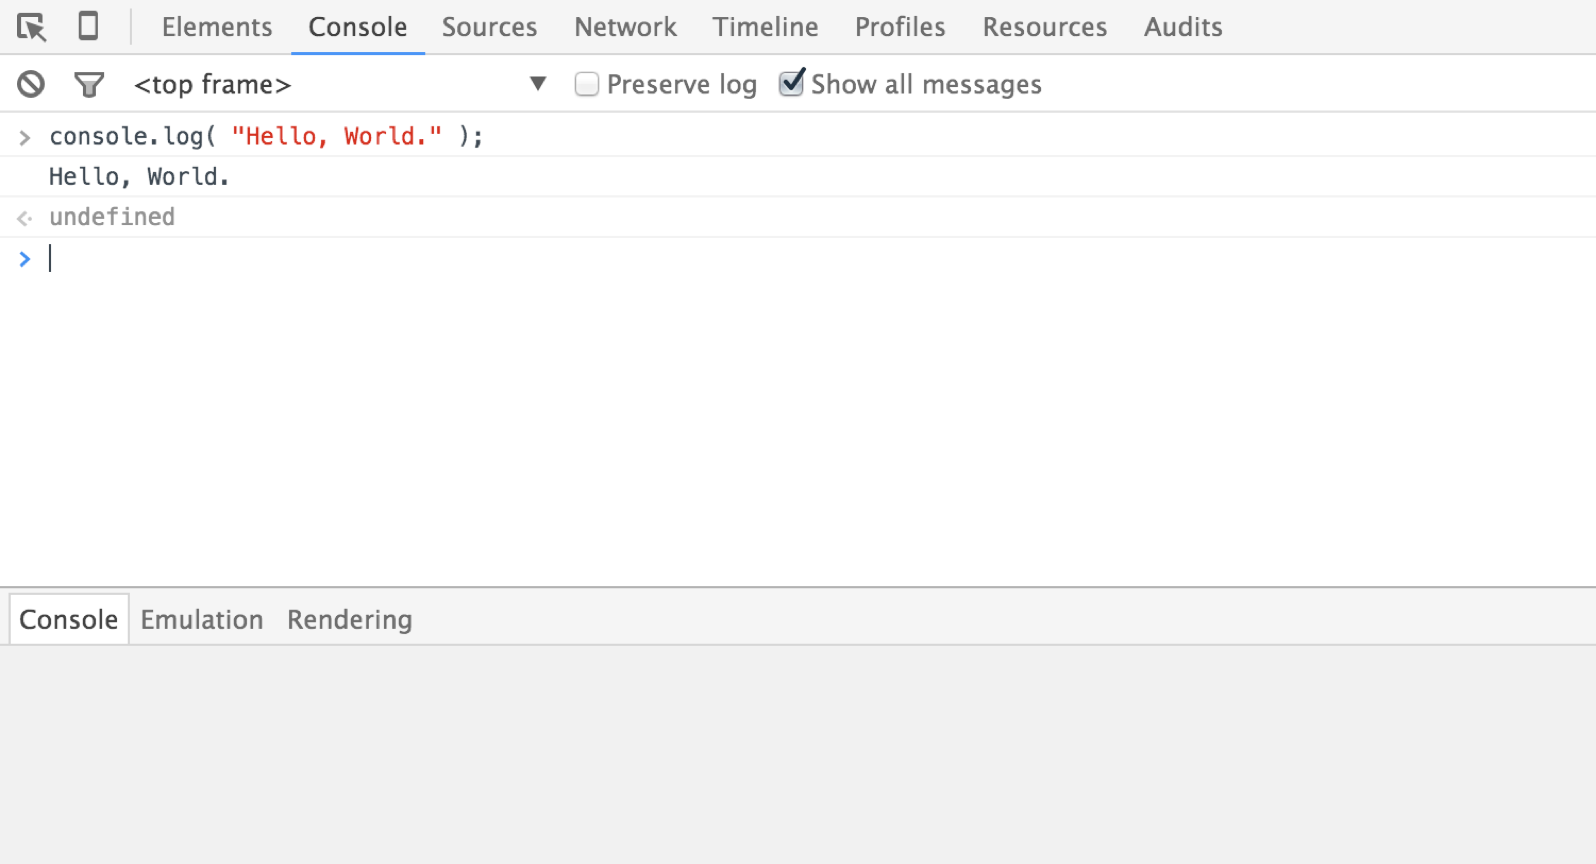
Fig 1.3: Well, hello to you too, dev console.
Now, I know this doesn’t seem like the most exciting thing in the world just yet, but we can use console.log to do a tremendous amount of work. It comes in a couple of different flavors, as well: we can use console.warn and console.error the same way we use console.log, to make particular issues and messages stand out (Fig 1.4).
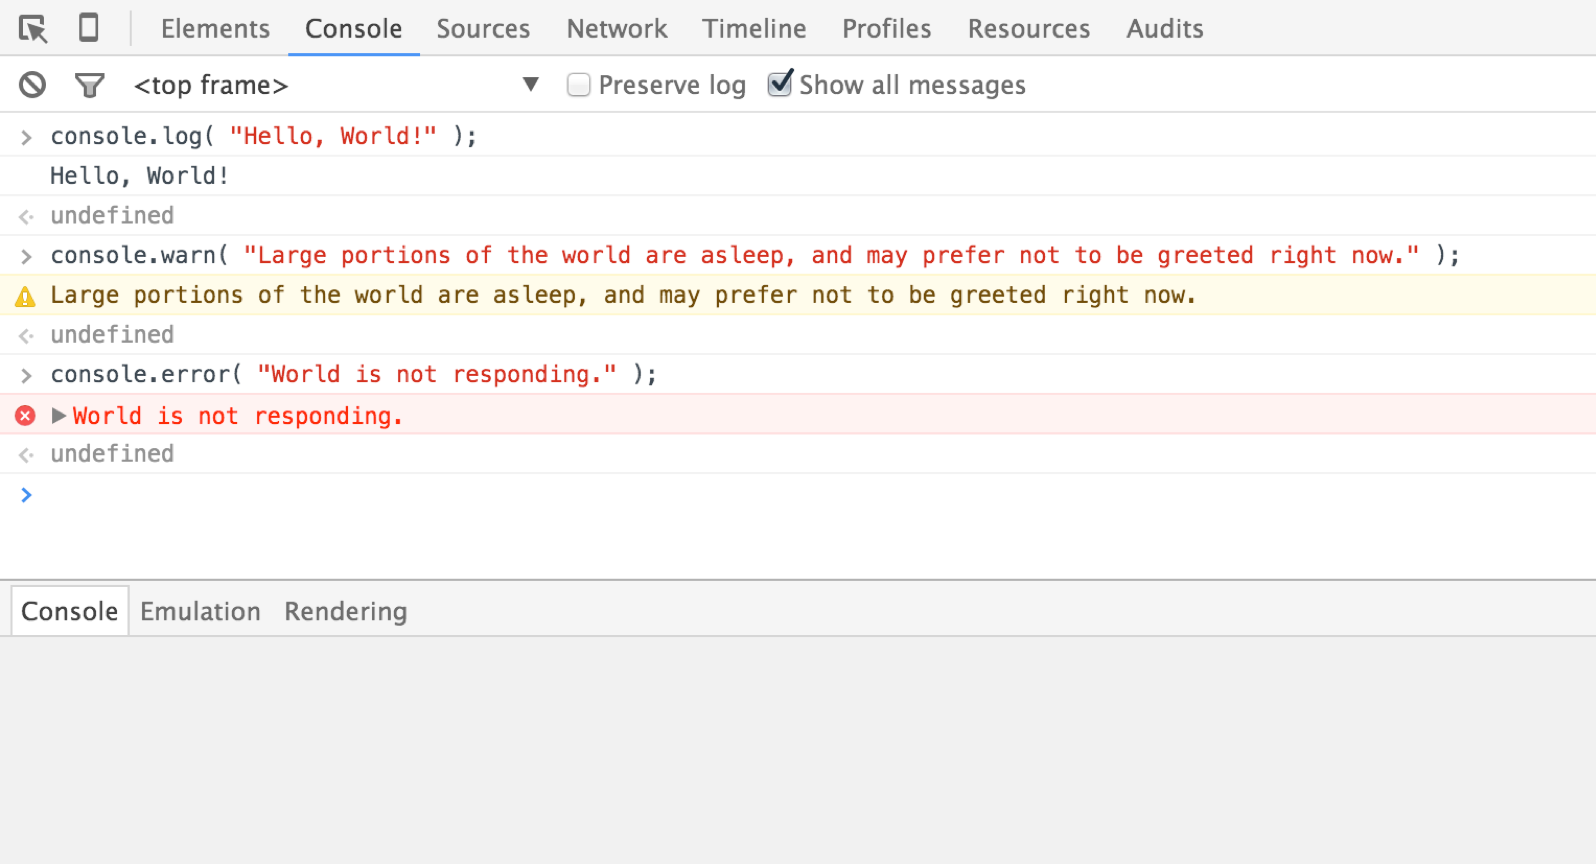
Fig 1.4: console.warn and console.error are both useful when debugging a script.
One final note on the topic of console.log and its ilk: while writing to a console is supported in every modern browser, support isn’t universal—some older browsers don’t have a console at all. In particular, IE6 and IE7 are famous for breaking down upon encountering the unrecognized console.log method, throwing errors that are likely to break your scripts.
Fortunately, these methods have little place in production code—they’re really only something we’ll be using when writing and debugging our scripts, so there’s little risk of it causing any problems for users—unless we leave one in by accident. Be sure to check for any leftover debugging code like console.log before using a script on a live website, just to be safe.
Now, the JavaScript console is more than just a place to log messages—you likely noticed the blinking prompt below the logs earlier. This input is the REPL I mentioned earlier—the read-eval[uate]-print loop.
This short explanation of the REPL is that it allows us to send things directly to the browser’s JavaScript parser, without needing to update our script file and reload the page. If you enter the same console.log("Hello, World."); in this space and hit return, it appears in the console.
We can use this to get information about the current state of elements on the page, check the output of scripts, or even add functionality to the page for the sake of testing. Right now, we can use it to try out new methods and get immediate feedback. If you punch in alert("Test") and hit enter, you’ll see what I mean: no changing files, no reloading the page, no-fuss-no-muss. Just an ol’-fashioned obnoxious modal window, made to order.
It bears repeating that we can’t do any real damage by way of the console. Any changes we make to the page or to our scripts by way of the console REPL will evaporate as soon as you reload the page, with no changes made to any of our files.
Now we have a couple of options for experimenting with JavaScript via the console, and a dev environment where we can start cobbling our first few scripts together. We’re ready to get started learning the rules of JavaScript.
JavaScript is complex for sure, but the global rules of the language are surprisingly simple—and generally pretty forgiving, with a few exceptions. It’s helpful to run through some of these rules upfront, and don’t worry if they don’t all make perfect sense before we have a chance to see them in action.
One strict rule—one that occasionally trips me up to this day—is that JavaScript is case-sensitive. That means that avariable and aVariable are treated as two completely different things. This can seem a little tricky when JavaScript’s built-in methods for accessing the DOM have names like getElementsByTagName, which doesn’t exactly roll off the tip of one’s keyboard.
For the most part, we can expect built-in methods to use camel case, capitalizing every word after the first, as in querySelector or getElementById.
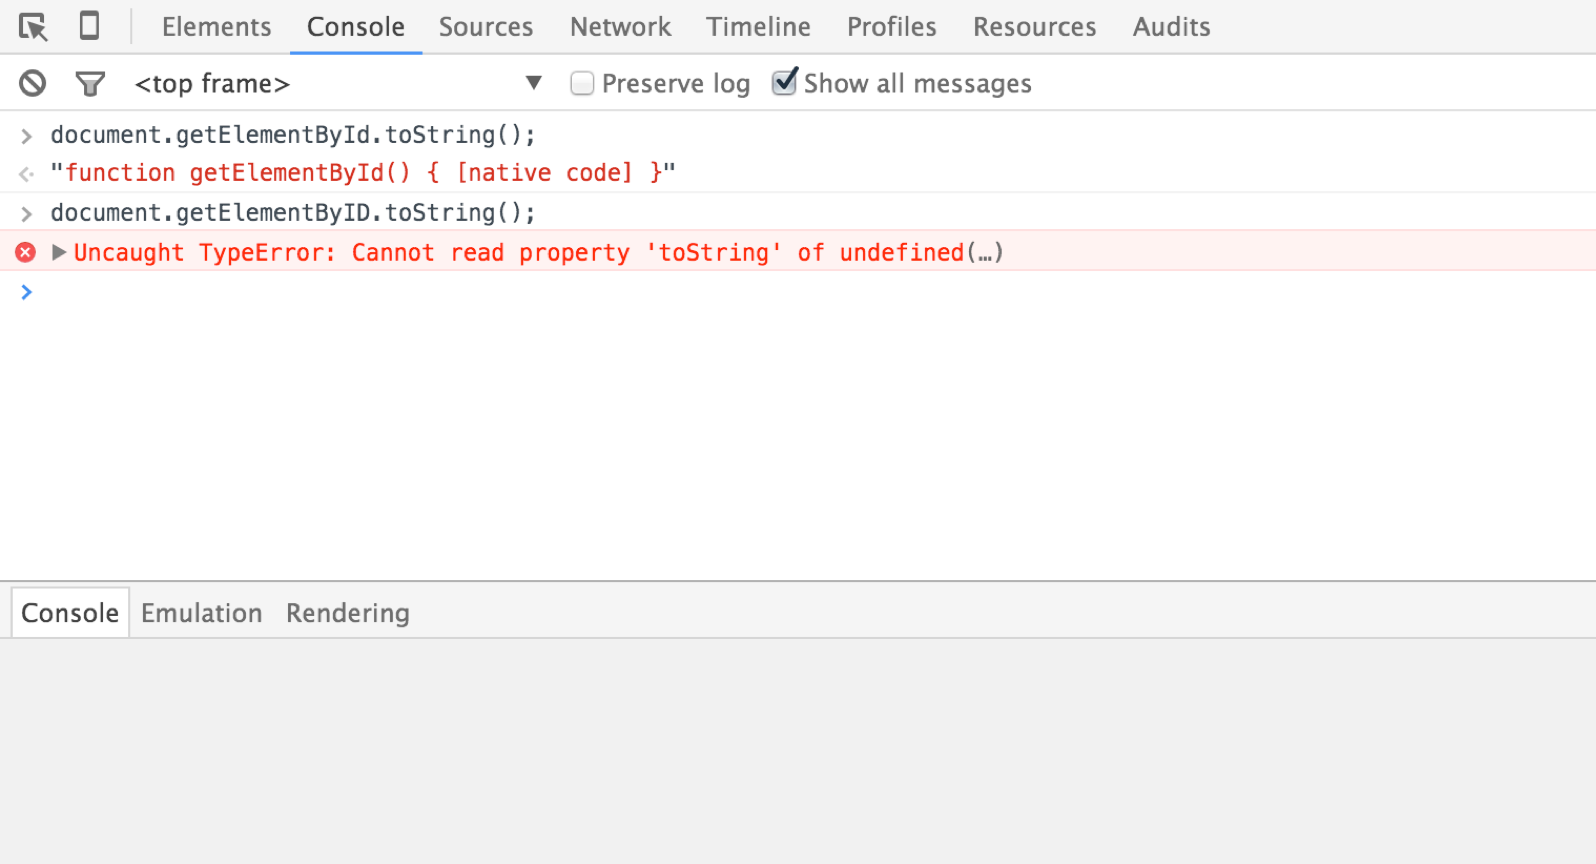
Fig 1.5: So close, yet so far away.
You can see this rule in action via the console: try entering document.getElementById.toString() and you’ll likely get a response that mentions native code—the browser recognizes this as a built-in method for accessing an item in the DOM. Enter document.getElementByID.toString() however—with the D in “Id” capitalized—and the browser only returns an error (Fig 1.5).
A statement in JavaScript should almost always end in a semicolon, which is a way to tell a JavaScript parser that it has reached the end of a command, the same way a period ends a sentence in English. This rule is a little flexible: a line break can also signal to a parser that it’s the end of a statement, thanks to something called Automatic Semicolon Insertion, or ASI.
Now, if you can believe this, programmers are an opinionated group. It won’t take much searching to find endless debates over whether to always use a semicolon at the end of a statement, or to just save yourself the occasional byte and let ASI do its job. Personally, I’m in the former camp—I’d always rather be explicit by using a semicolon than risk omitting one that I wasn’t supposed to, and I find that it makes code easier to read for the next person who comes along and needs to maintain it. For now, I’d definitely recommend you do the same. It takes a while to get the hang of where semicolons are absolutely necessary and where ASI can fill in the blanks, so we’re better off erring on the side of caution.
Perhaps weirder still, line breaks are the only form of white space—which includes tabs and spaces—that has any real significance to JavaScript, and even then it’s only the first one that counts. Whether you use fifty line breaks between lines of code, or start every line with ten tabs and a space for good luck, JavaScript will ignore it all the same. Only the first newline, where ASI comes swooping in to assume you’re between statements, has any real significance.
JavaScript allows you to leave comments that are ignored when the script is executed, so you can leave reminders and explanations throughout your code. I find this helpful on a day-to-day basis: leaving myself pointers and reminders of why things are set up a certain way, or comments telling myself that part of the code still needs some work.
Far more important than that, however, is keeping in mind that you won’t always be the single owner of a codebase—even if you’re not working on a team, there’s a chance that someone else may end up making changes to your code someday. Well-commented code serves as a roadmap for other developers, and helps them understand what decisions you made and why.
There are two flavors of comment native to JavaScript, one of which will be familiar to anyone who’s spent quality time with CSS. Multiline comments are handled using the same syntax as CSS comments:
/* This is a multi-line comment.

Anything between these sets of characters will be
ignored when the script is executed. This form of
comment needs to be closed. */
JavaScript also allows for single-line comments, which don’t need to be explicitly closed. Instead, they close as soon as you start a new line.
// This is a single-line comment.
Unexpectedly, single-line comments can wrap to as many lines as necessary in your editor, so long as they don’t contain a line break—as soon as you press Return to start a new line, the comment is closed, and you’re back into executable code. The wrapping that might be performed by your code editor—depending on the editor itself and your settings—is called “soft wrapping.” Single-line comments won’t be impacted by soft wrapping, since it’s strictly an editor-level convenience.
console.log("Hello, World."); // Note to self: should “World” be capitalized here?
Now that we know the rules of the game and we’ve set up a couple of places to experiment, we’re ready to start learning about the building blocks that make up JavaScript. In terms of sitting down and writing a script from start to finish, they might not seem like they amount to much on their own—but the things we’re about to cover in the next chapter are critical to understanding how JavaScript treats data.